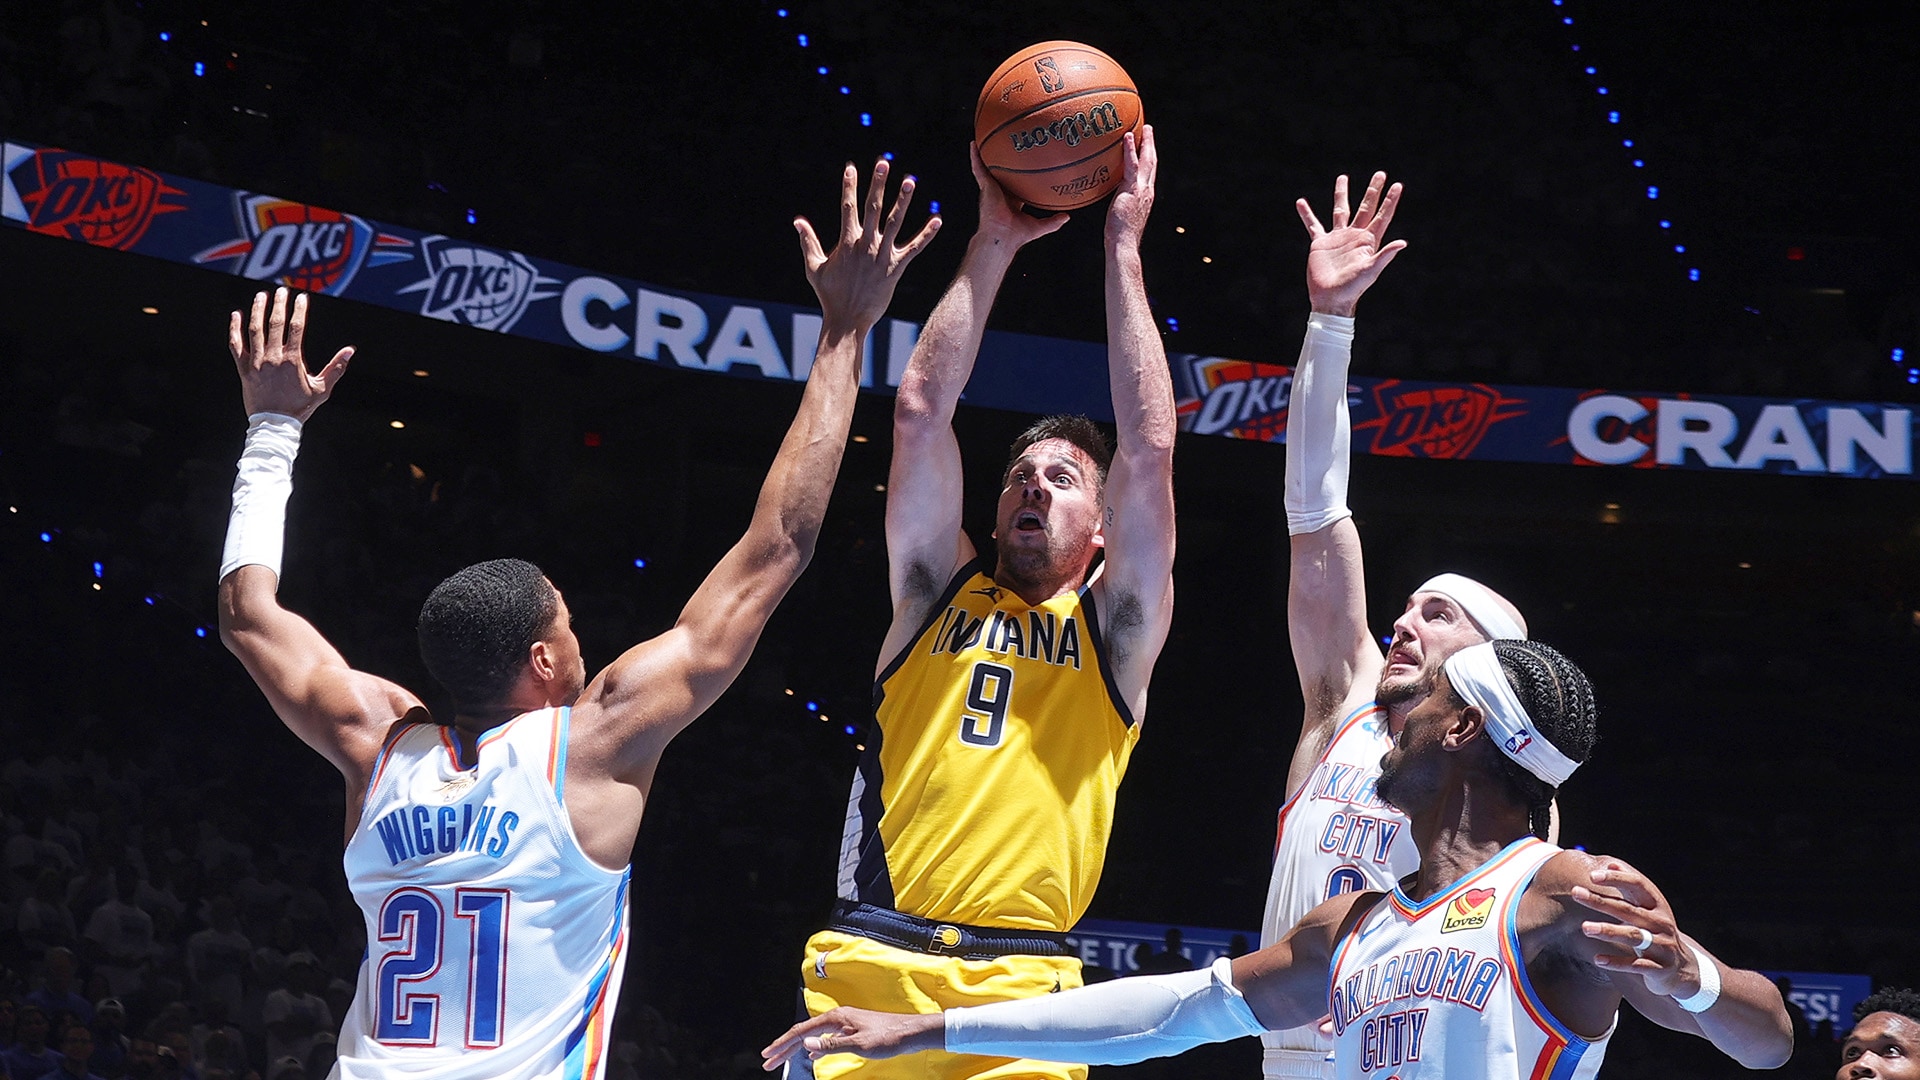
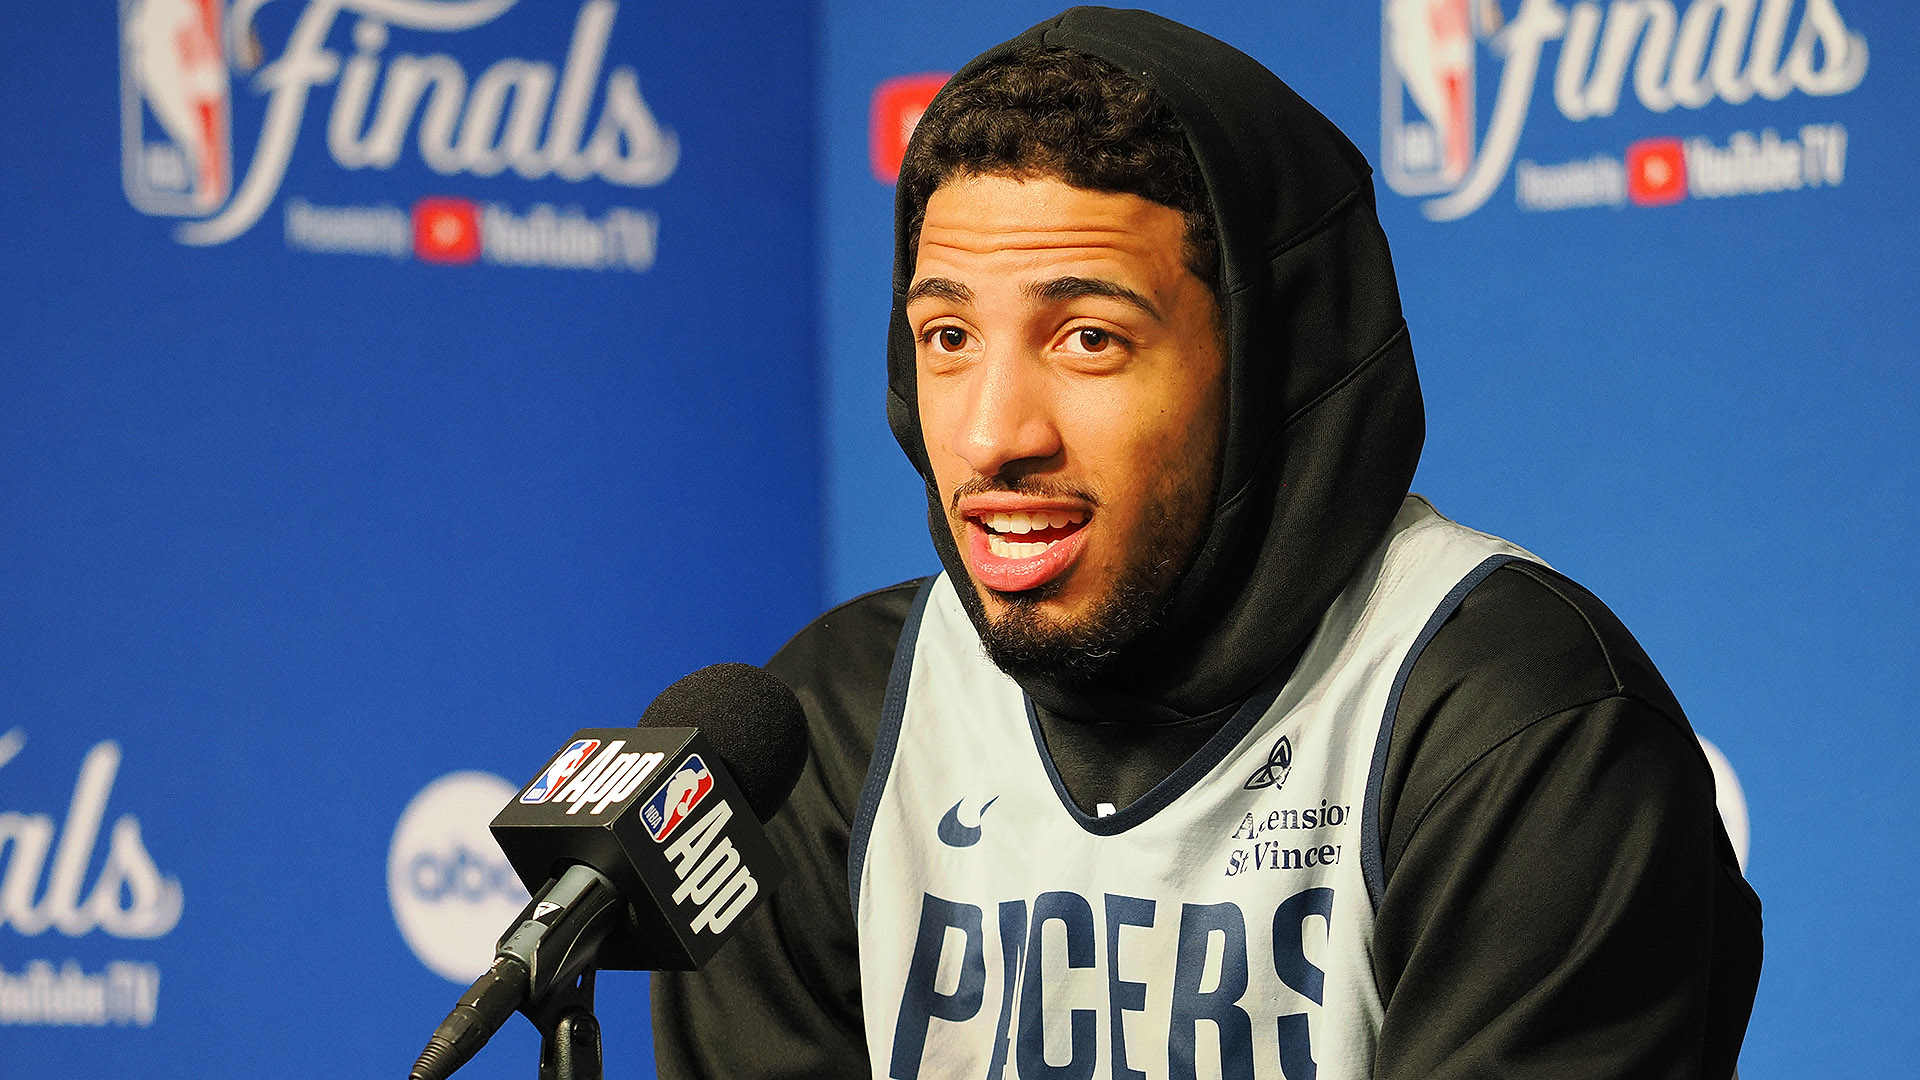
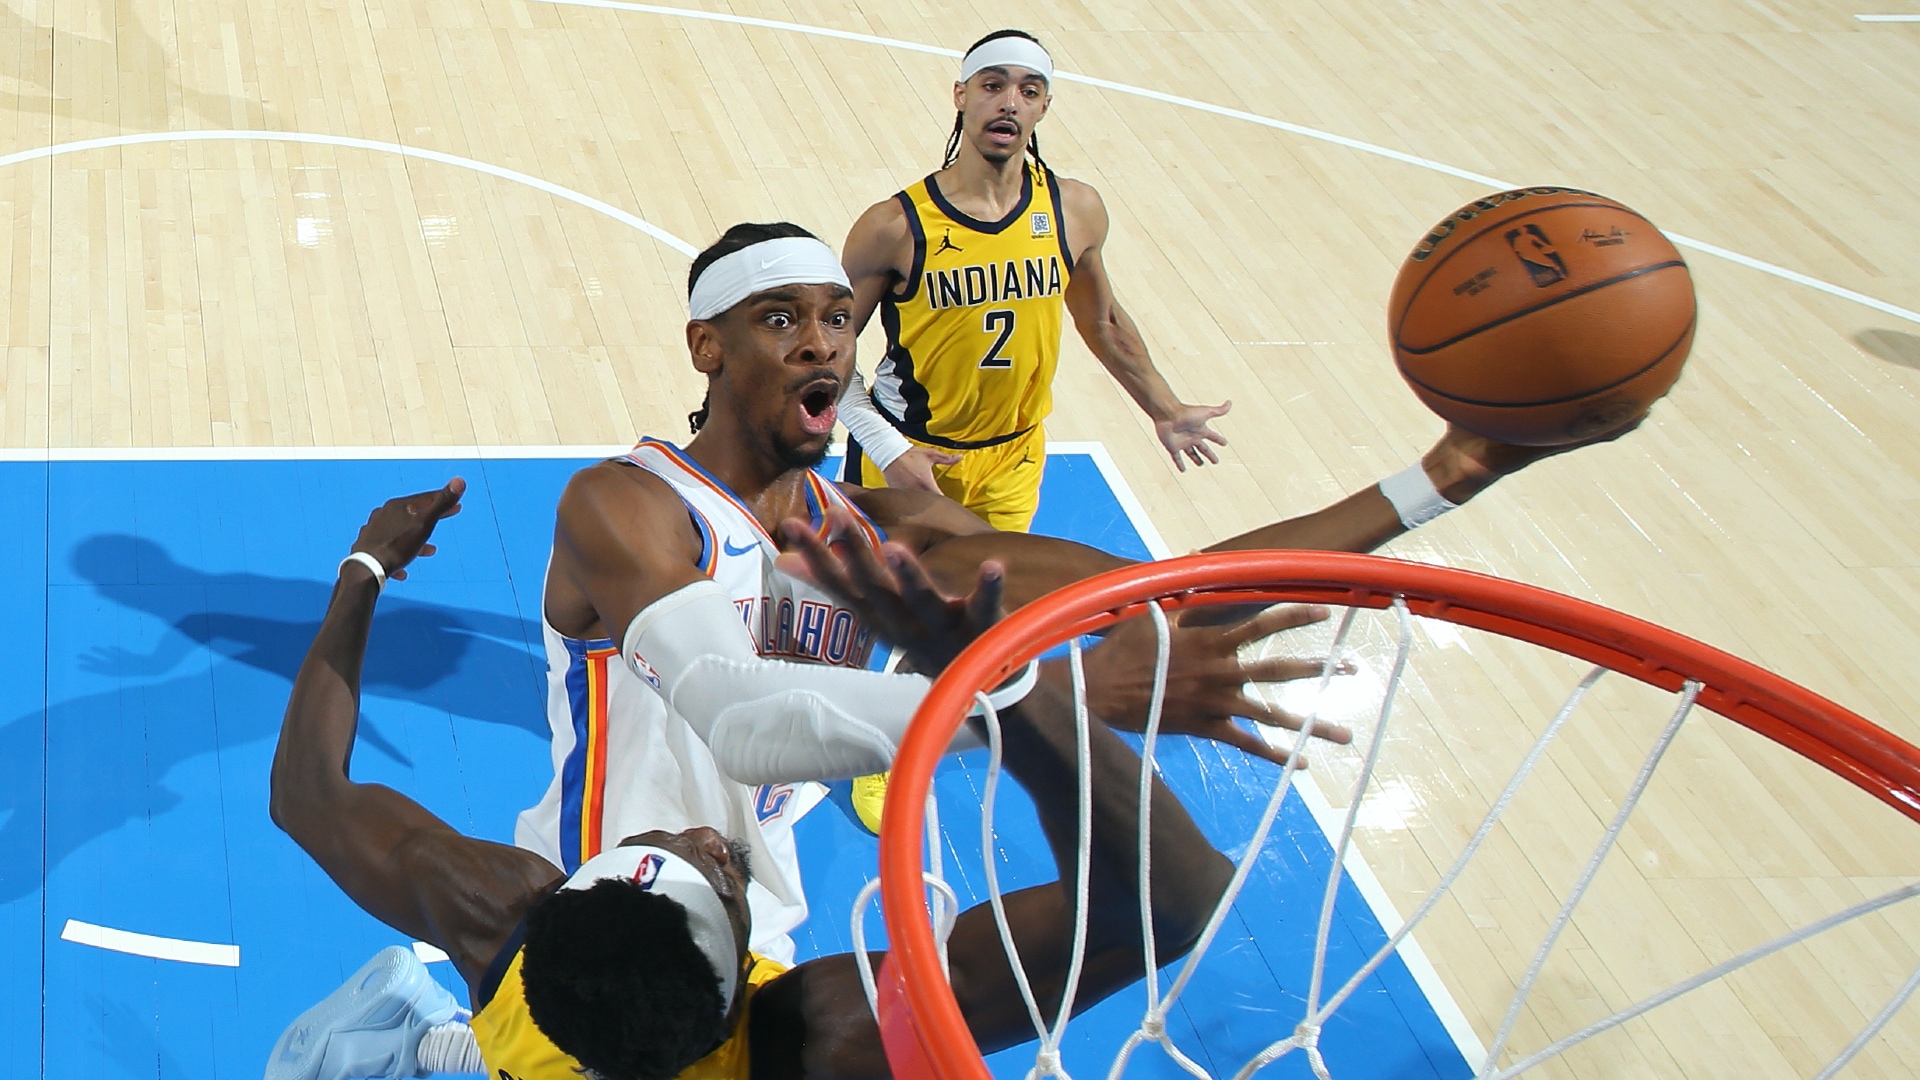
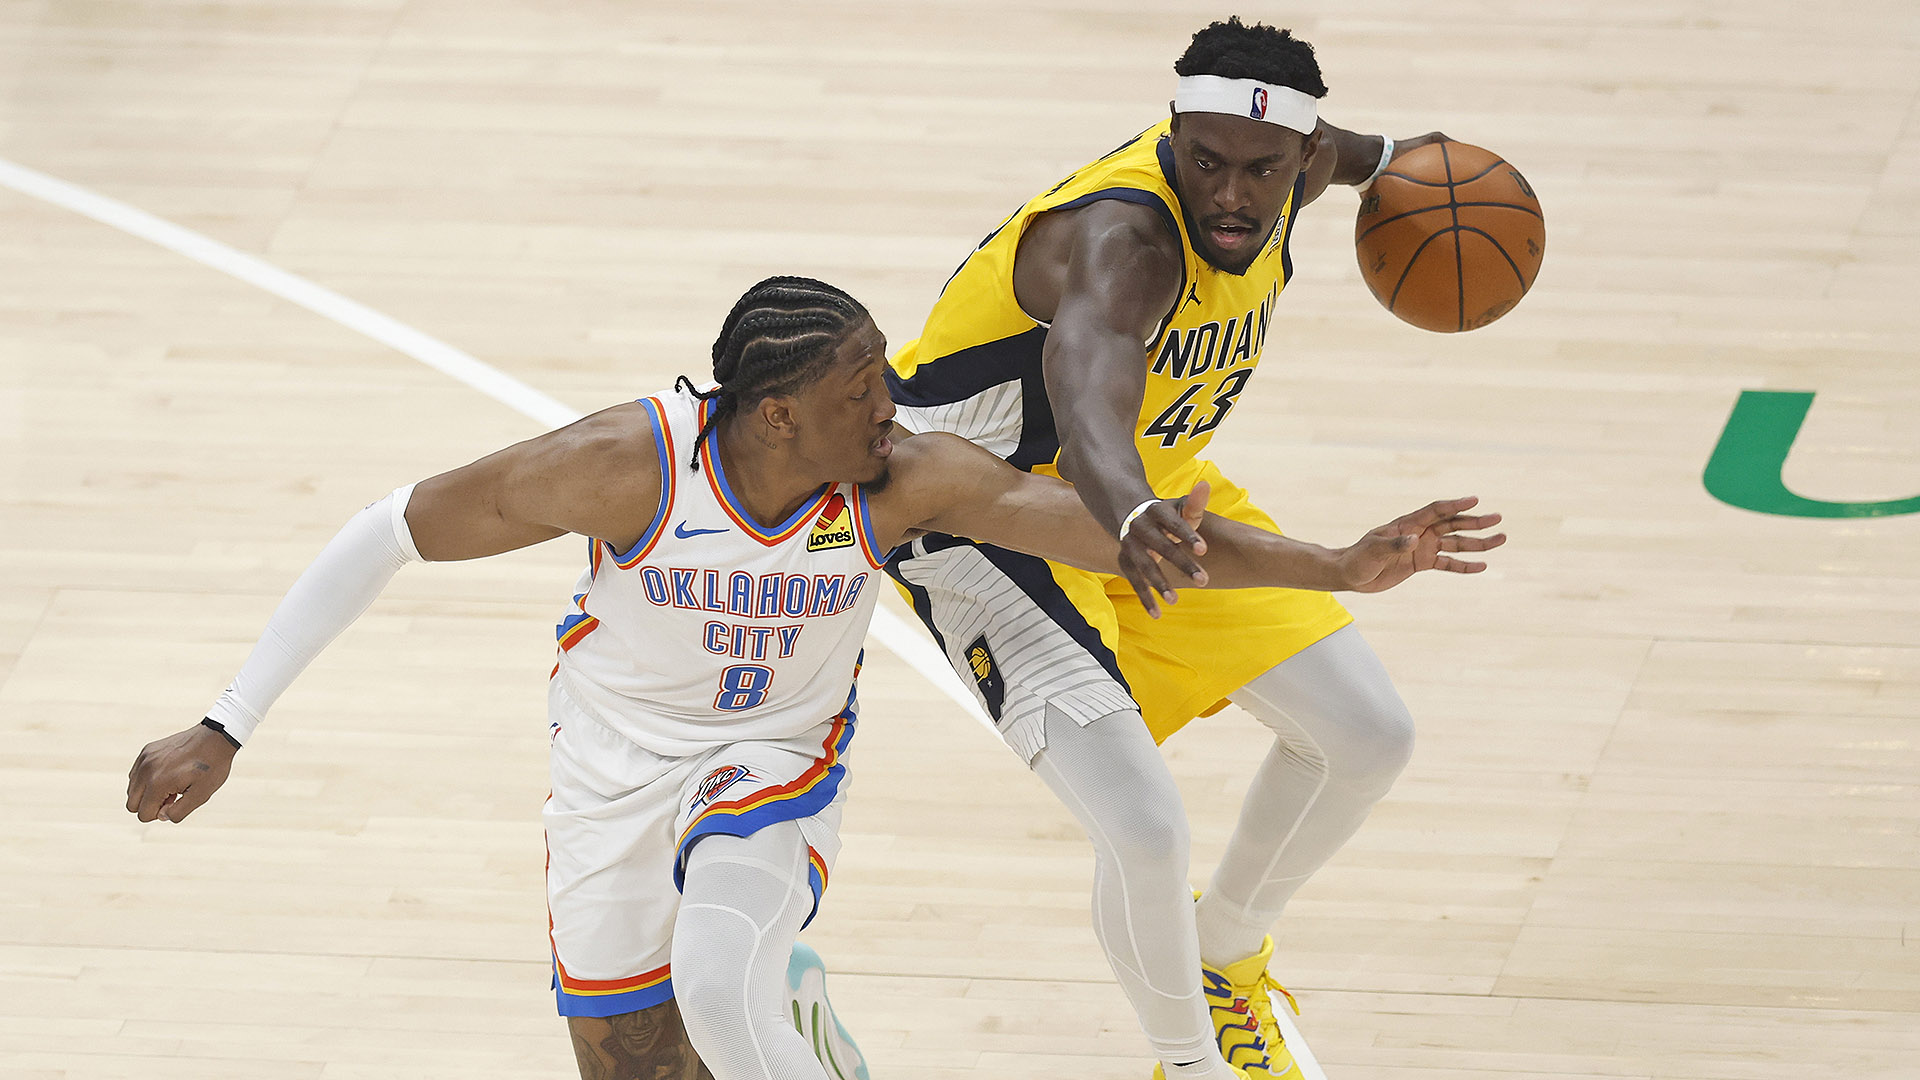
As a raucous OKC crowd cheers him on, Jalen Williams drops a playoff career-high 40 points to give the Thunder a 3-2 lead in the Finals.
INDIANAPOLIS – The Oklahoma City Thunder are one win from their first championship. But the Indiana Pacers are home and have the opportunity to send the NBA Finals to a Game 7 for the first time in nine years.
Here are 10 numbers to know before Game 6 on Thursday (8:30 ET, ABC) …
1. 598
According to Second Spectrum tracking, the Pacers have thrown an incredible 598 more passes than the Thunder over the five games, a difference of 120 passes per game. Ball movement has always been a huge part of the Indiana offense, and the aggressive Oklahoma City defense will make you move the ball more than usual. The Pacers 386 passes per 24 minutes of possession is their highest rate for any round in these playoffs.
The Thunder meanwhile, have gotten 58.2 points per game from Shai Gilgeous-Alexander and Jalen Williams, with only 21% of their field goals having been assisted.
2. 31
The Thunder have had 31 more shooting opportunities (field goal attempts or trips to the line) than the Pacers over five games. The Pacers have actually done better with their shooting opportunities, registering a true shooting percentage of 58.3%, compared to the Thunder’s 57.1%.
But Oklahoma City has won the possession game, with 26 fewer turnovers and nine more offensive rebounds. Their Game 3 victory was the only game in the series (and just one of six times in their 21 playoff games) where the Pacers had more shooting opportunities than their opponent.
3. 229
The Thunder have recorded 229 steals (live-ball turnovers for the opponent) in the playoffs. That’s 23 more than any other team in the 52 postseasons that steals have been recorded. But their leader (Alex Caruso) ranks just 27th among individuals over those 52 years with 42 total steals.
Oklahoma City disrupts Indiana’s timing and spacing in Game 5 by forcing 23 turnovers, leading to 32 points.
4. 110.1
If you throw away the last game of the regular season (when they were without Tyrese Haliburton and Pascal Siakam), the 110.1 points per 100 possessions that the Pacers have scored in the Finals would be their worst five-game stretch of offense since the All-Star break.
Their true shooting percentage of 58.3% is higher than that of the Thunder, but it’s their lowest mark for any series in these playoffs, and their turnover rate (18.7 per 100 possessions) is their highest by a huge margin.
5. 14.0
The other end of the floor has been the more determining factor, with the Thunder scoring 14.0 more points per 100 possessions in their three wins (120.4) than they have in their two losses (106.4). That’s been as much about their free throw rate (40.6 vs. 30.5 attempts per 100 shots from the field) and their offensive rebounding percentage (36.4% vs. 28.3%) as it’s been about how effectively they’ve shot from the field.
6. 65
The Thunder have outscored the Pacers by 65 points in the restricted area (+34) or at the free-throw line (+31). The Pacers are plus-41 on field goals from outside the restricted area.
7. 14.5
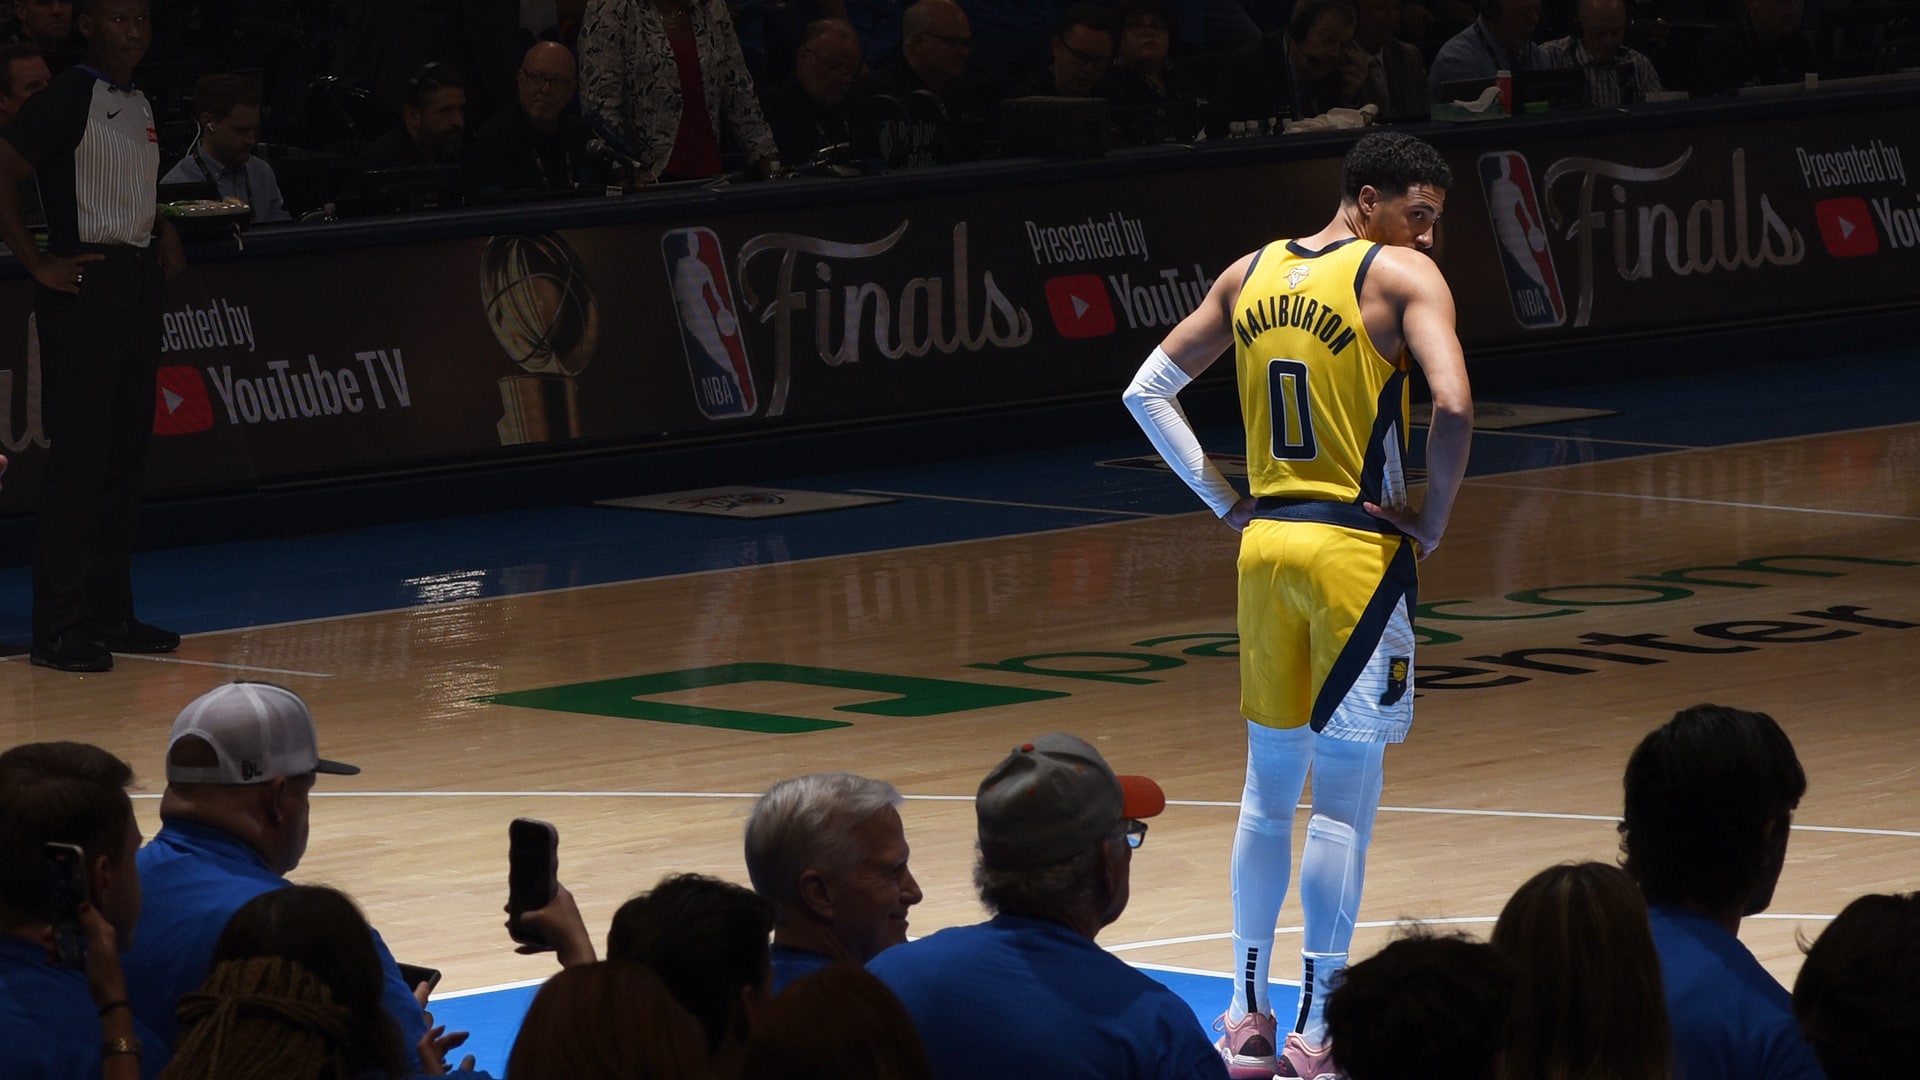
The Pacers have been outscored by 14.5 points per 100 possessions in Haliburton’s 60 minutes off the floor. Game 5 (when he was dealing with a calf injury) was the first time in the series that Indiana lost Haliburton’s minutes on the floor by a significant margin. And while both teams can go deep on their bench, the Thunder’s bench minutes have been much more successful than those of the Pacers.
8. 49.1%
The Pacers have shot 49.1% on corner 3-pointers in the Finals. They’ve made 11 more corner 3s than the Thunder, but their five corner 3-point attempts in Game 5 were their fewest in the series.
They’ve also shot just 31.3% on above-the-break 3s, their worst mark in any of their four series and down from 39.8% over the previous two rounds.
9. 17.4%
The two teams have combined to shoot just 12-for-69 (17.4%) from 3-point range in the last six seconds of the shot clock, according to Second Spectrum. The Thunder finally got their transition game going in Game 5, but the Pacers have averaged just 15.4 transition points per game, down from 25.8 per game through the first three games, according to Synergy tracking.
And Indiana has really struggled when it’s had to work late in the clock, shooting just 25.5% from the field (including 7-for-47 from beyond the arc) in the last six seconds. The Thunder haven’t been much better (28.6%, 5-for-22), but haven’t had to work late in clock as much as Indiana.
10. 0.63
The Pacers have scored just 0.63 points per chance (24 on 38) when the Thunder have switched a ball-screen for Haliburton, according to Second Spectrum. Indiana has scored 0.92 points per chance when Oklahoma City has used some other pick-and-roll coverage against the Pacers’ point guard.
Switching can limit the Pacers’ ball movement and encourage Haliburton to isolate against the switching defender. Indiana has scored just 0.45 points per chance (nine on 20) when Haliburton has isolated, down from 1.16 through the first three rounds.
* * *
John Schuhmann is a senior stats analyst for NBA.com. You can e-mail him here, find his archive here and follow him on X.
The views on this page do not necessarily reflect the views of the NBA, its clubs or Warner Bros. Discovery.

